YouTube Analytics now includes Time Watched, Annotation reporting, and more
Understanding what your audience likes is key to building a successful YouTube channel, so we've created more tools to help you interpret the performance of your videos. Here are some improvements we’ve made to YouTube Analytics in the last few months.
Audience Engagement
Earlier this year we started focusing on the time users spend watching YouTube when we suggest videos. To give you additional insight into engagement for your videos, we’ve enhanced the “Views” report to show more time watched data.
You can see “Estimated minutes watched” from the “Views” report or choose other data options from the “Compare metric” drop-down menu.
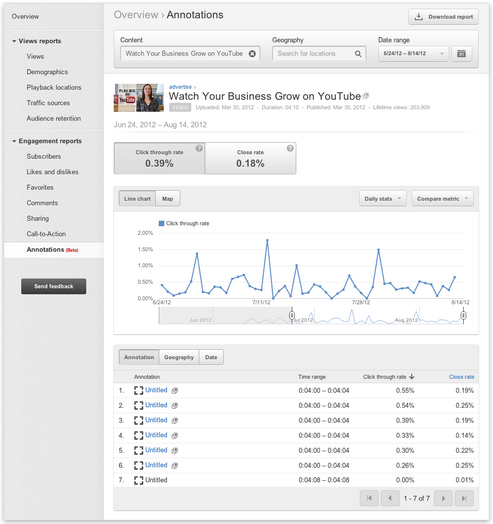
Annotations are one of the most used features to drive audience engagement in YouTube. You can now use the beta version of Annotations report to view data on the performance of your video annotations, with insights on viewer click and close rates.

Making Analytics easier to use
Date slider is back and better than ever. Now you can quickly adjust the date range and see how your videos performed across different time periods.
You can average data across time with rolling totals for 7- and 30-day totals. Instead of seeing changes in weekend traffic and other cyclical data, rolling totals will smooth the trends to help you see overall growth without the distracting spikes and dips.
The metadata section for your videos and channels instantly provides you with data such as lifetime views and video duration.
The video hovercard helps you see a thumbnail of your video and basic information by simply hovering over your video link.
Compare metrics provides you with more ways to compare trends and patterns across two different metrics.
We understand the importance of having data and insights for your channel and want to continue improving our analytics to help you grow your audience. Please let us know if there are any other features you would like us to build, in the comments below.